

 Search

 Call: 074-2915208
TOPdesk Analytics Dashboard Suite
Use data that your organization collects by using TOPdesk software. TOPdesk offers you the software to manage incidents, Victa helps you to create insights based on TOPdesk data. Find out how you can improve your service level by using the TOPdesk Analytics Dashboard Suite.
TOPdesk Dashboard Suite includes:
Powered by Qlik Sense Enterprise
The TOPdesk Analytics Dashboards have been developed on the powerful Business Intelligence (BI) platform of Qlik Sense. Qlik Sense has a unique, patented memory-based associative technology that allows users to analyze information quickly, dynamically and interactively.
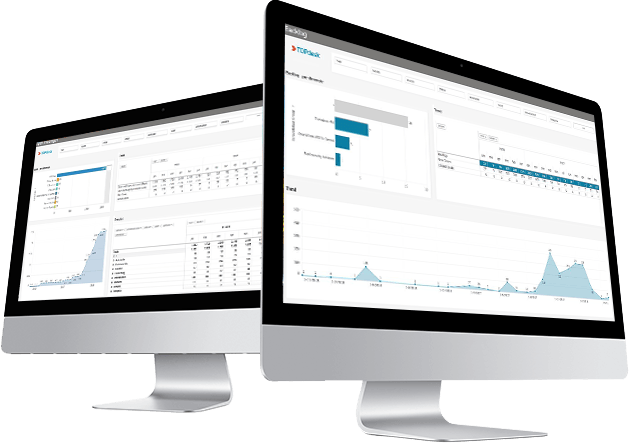
All information is displayed in powerful graphics such as funnel charts, gauges and pie charts. There are also list views suitable for printing and reports. In the monitor you can descend to the lowest level of detail (watch for an incident). In short, all data is easily and quickly available. In the Qlikapplication it is possible to print each of the different information components in report form. This can be done for email (PDF) and physical printing so you can share this information with your colleagues at all times.
Advantages of our TOPdesk Analytics Dashboard Suite:
- Enterprise BI solution for a small business price;
- Go beyond query-based tools and explore your data without blind spots;
- Real-time monitoring of incidents, changes, assets or sources;
- Very user-friendly interface, anyone can create insights;
- Supported by any device;
- Pay per user per month;
* Optional: Consultancy services are required for custom dashboards and / or on-site deployments.
* Optional: combining multiple external data sources with your TOPdesk data requires consultancy services.