

 Search

 Call: 074-2915208
Functionality
The Twinfield Dashboard offers the following functionalities / analyzes:
- balance
- Loss and Profit
- General ledger analysis
- Ledger cards
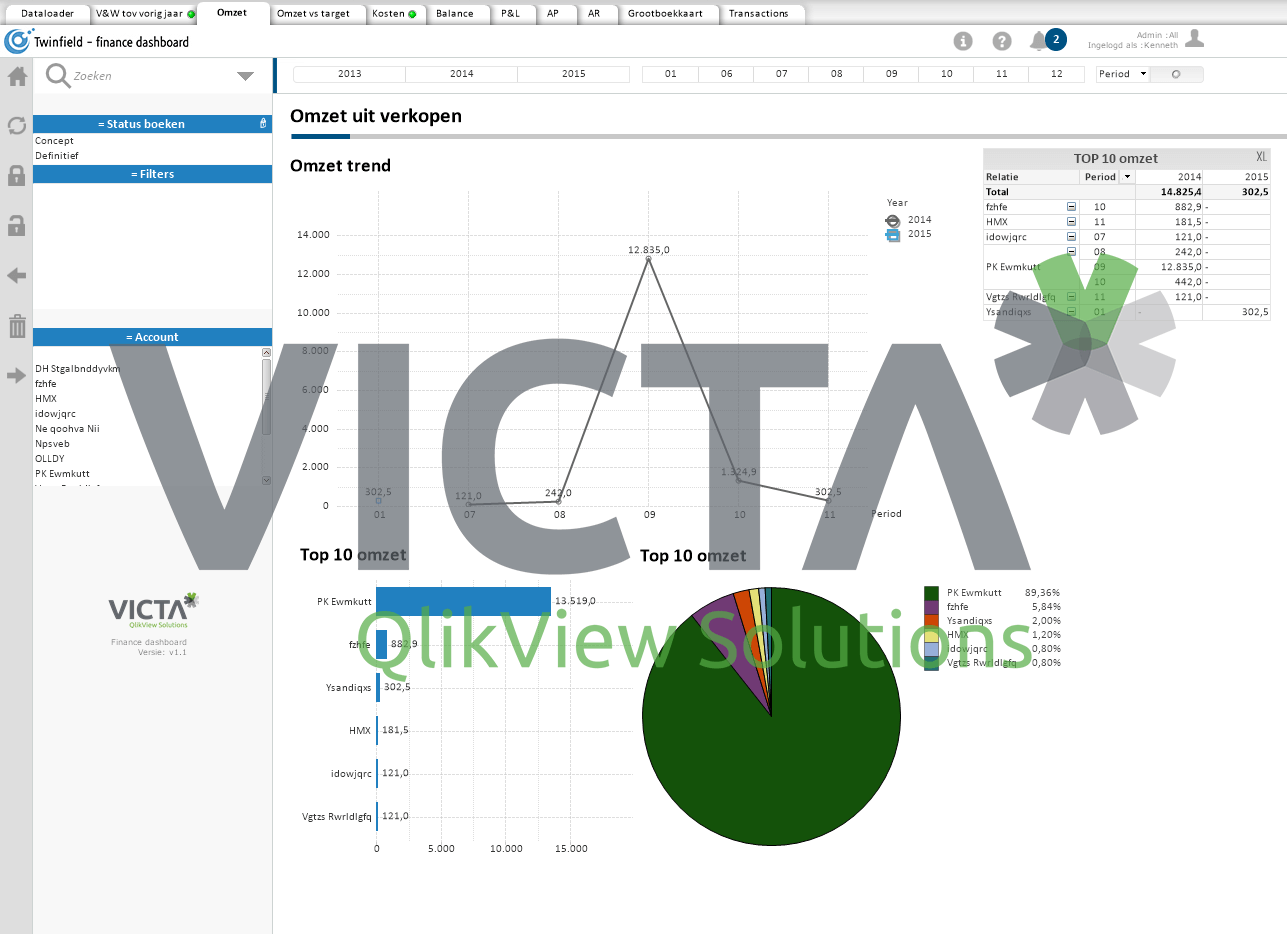
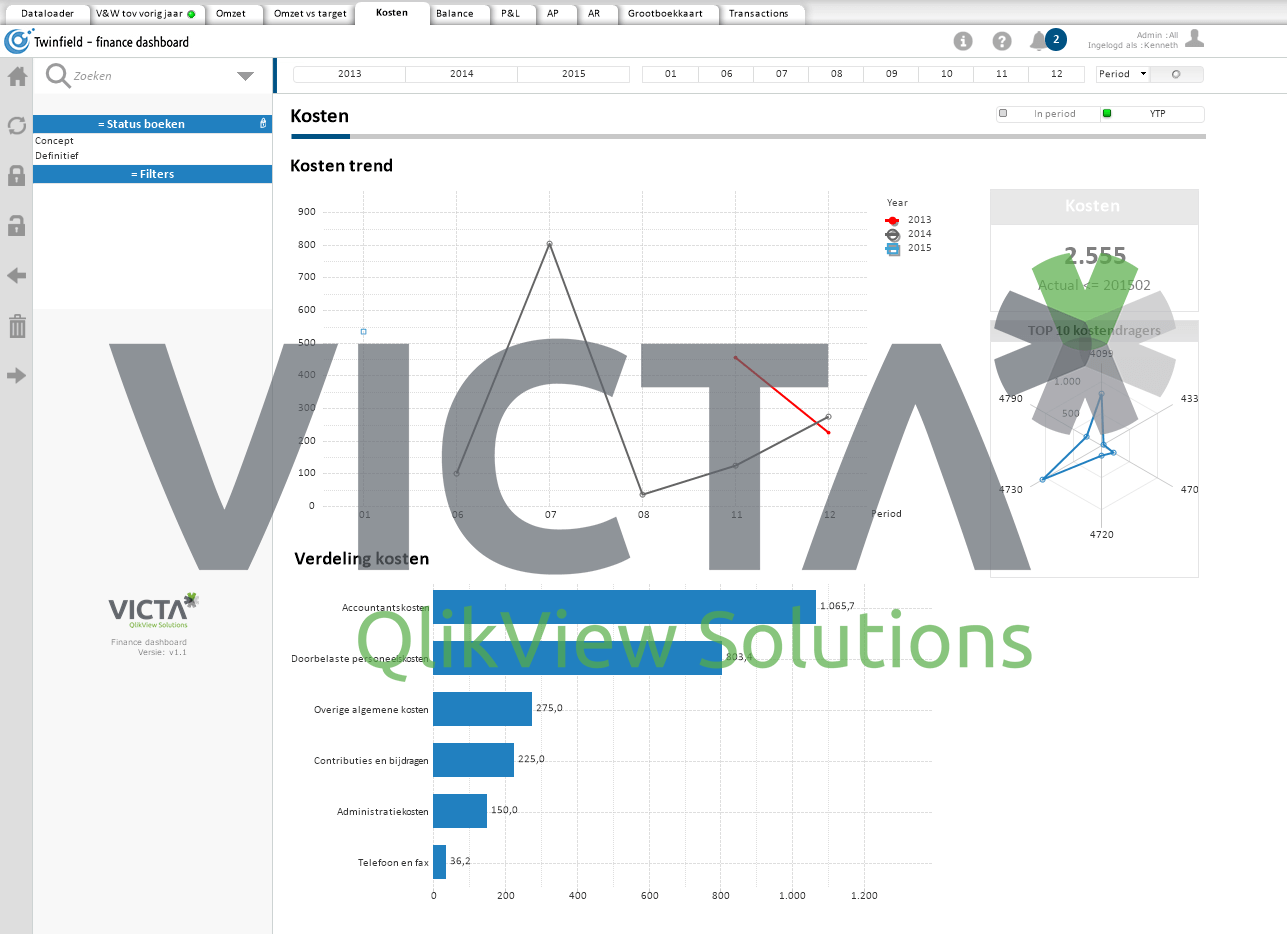
- Sales-cost analysis
- Sales versus budget analysis
- Cash flow analysis
- Forecast
- What-if analysis
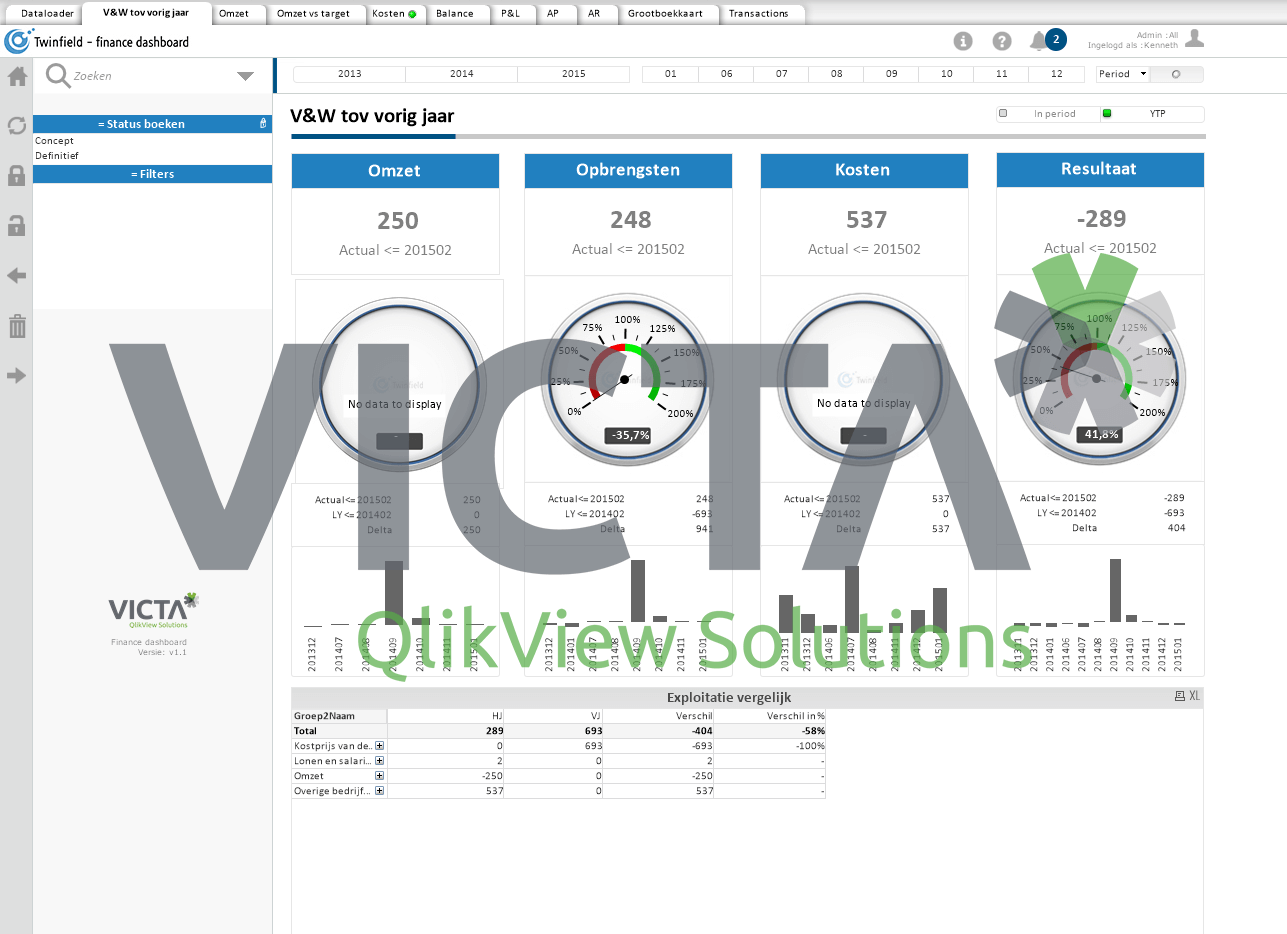
Powerful Analyzes
All information is presented in powerful graphical displays such as Bar charts, gauges (meters), pie charts (pies) and pivots (pivot tables). There are also extensive list views suitable for prints and reports. The dashboard can be zoomed in to the lowest GL detail level. In short, all data is easily and quickly available for you and your employees.
Within the QlikView and Qlik Sense application makes it possible to print each of the various information items in report form. This is possible for both the email (PDF) and physical print so that you can easily share this information with your colleagues. Automatic distribution of data is also possible.
Online integration
Victa has developed a connector (based on web services) especially for Twinfield with which real-time and online data can be read from any desired location. The connector is easy and quick to set up with the access data of your Twinfield administrations (s)
Easy to integrate
Qlik Twinfield is easy to integrate with other data sources. With the powerful Qlik engine, links can be made quickly with databases or data files (XLS, XML, CSV, HTML etc.). All possible data exports can also be facilitated from the dashboard. A frequently used export is, for example, to Excel.
Time to Value
The Twinfield Finance Dashboard can be rolled out in the foreseeable future. The result is a powerful BI solution that can be quickly implemented throughout your organization, resulting in a fast time to value and a high ROI. Due to the rapid implementation of QlikView and Qlik Sense for Twinfield allows you to get more out of your business administration and you quickly gain insight into the financial situation of your company
Get started quickly with a SIB “Seeing is Believing”
We are convinced of the power of this application and offer you the opportunity to become acquainted with this product on your own data without obligation. With the SIB you get the AccountView dashboard and the accompanying Qlikview of Qlik Sense software available for free for four weeks. After this period you can decide whether the monitor offers added value for your organization.