

 Search

 Call: 074-2915208
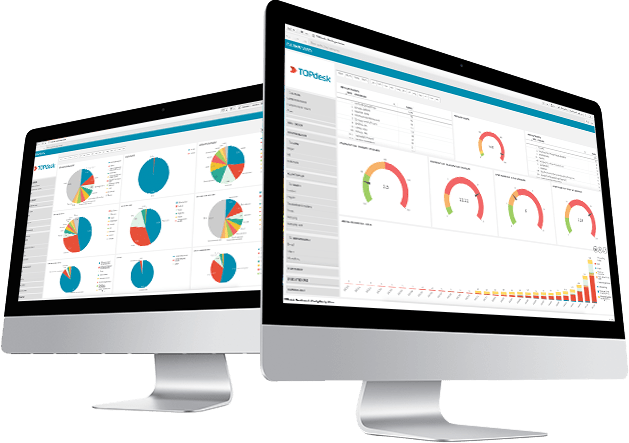
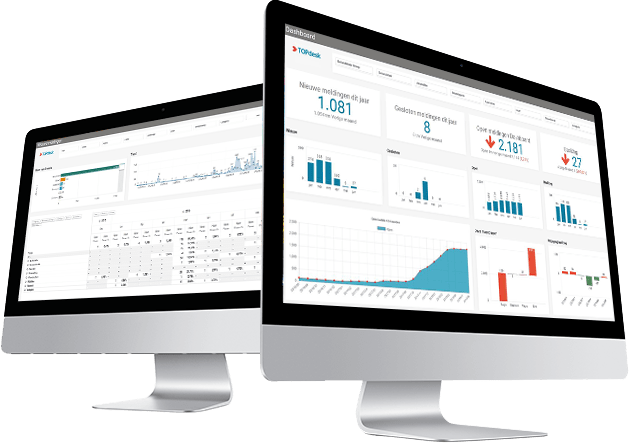
TOPdesk Analytics - Dashboard Suite
With Dashboard as a Service for TOPdesk, Victa accesses the data from your TOPdesk (SaaS) environment and makes it available for analysis in our dashboards. You will receive a link and login from us and then you can start creating new insights into your TOPdesk data.
Watch the Webinar here.
Powered by Qlik Sense Enterprise
The TOPdesk Analytics dashboards have been developed on the powerful Business Intelligence (BI) platform of Qlik Sense. Qlik Sense has a unique, patented memory-based associative technology that allows users to analyze information quickly, dynamically and interactively.
All information is displayed in powerful graphics such as funnel charts, gauges and pie charts. There are also list views suitable for printing and report creation. In the dashboards you can descend to the lowest level of detail (search for an incident). In short, all data is easily and quickly available. In the Qlikapplication it is possible to print each of the different information components in report form. There is also a presentation (Story Telling) module with which you can prepare a presentation in PowerPoint style and share it with colleagues. Here you can, for example, provide context to certain insights or determine actions based on outcomes.
Available TOPdesk modules


More information about the TOPdesk dashboard solutions can also be found on the TOPdesk marketplace.
- TOPdesk Analytics Dashboard Suite
- TOPdesk Analytics - Incident Management
- TOPdesk Analytics - Change Management
Example analyzes:
- How many incidents / changes are reported at what time of the day? Which days of the week have the most incidents / changes reported?
- How many support agents do I need at what time of the year?
- What makes our turnaround time extremely long?
- How many incidents are not resolved within our SLA term? Which incidents have not been resolved and why have they not been resolved?
- Monitor the performance of individual employees, teams and departments.
- Discover trends: compare reports / changes between days, weeks, months or years.
- There are many more relevant analyzes hidden in your TOPdesk data ...
Advantages of our TOPdesk analytics dashboard suite:
- Enterprise BI Solution for Small Business price;
- Go beyond query-based tools and explore your data without blind spots;
- Real-time monitoring of incidents, changes, assets or resources;
- Very user-friendly interface, anyone can create insights;
- Supported by any device;
- Pay per user per month.