

 Search

 Call: 074-2915208
Jisse: From the field of business intelligence, I am often asked for my opinion about which business intelligence tool is the best. The answer that follows cannot be given unequivocally. “It depends…” my answer usually begins. What is the critical issue that the tool should solve for your organization? What kind of data sources should be unlocked? What knowledge is available within the organization? Where is your organization going in the field of data? And there are countless questions I can ask that influence the suitability of a BI tool.
From a marketing perspective, the top BI tools in the market can almost all do the same. This is certainly the case in terms of basic functionalities in the field of business intelligence. However, in practice many more things are important than just the visible functionalities of a BI tool. Through this article I want to provide insight into a number of important differences between Power BI and Qlik Sense so that a solid choice can be made between these business intelligence applications.
To paint a good picture I use the setup from the Gartner Magic Quadrant for BI & Analytics (February, 2019). I start with an introduction of the supplier and the BI tool, then I name 3 strengths and 3 points for attention, I sketch a scenario for a hybrid option and I end with a conclusion. The difference with the Gartners' Magic Quadrant is that the points mentioned from the Magic Quadrant are combined with our own experience and the experience of our customers with both tools.
The article is structured as follows:
- Introduction
- Microsoft Power BI
- 3 Strengths of Power BI
- 3 Considerations for Power BI
- Qlik Sense.
- 3 Strengths of Qlik Sense.
- 3 Points to consider for Qlik Sense.
- Hybrid scenario
- Conclusion
- References
Microsoft Power BI
In 1985 Microsoft took the first step towards business intelligence through Excel. Excel gave users the opportunity to gain insights from data. Through expansion options, such as Power Pivot, the possibilities for modeling and analyzing data were continuously expanded. Data analysts were thus able to analyze large amounts of data from various data sources. Microsoft has now set itself the goal of making business intelligence accessible to everyone.
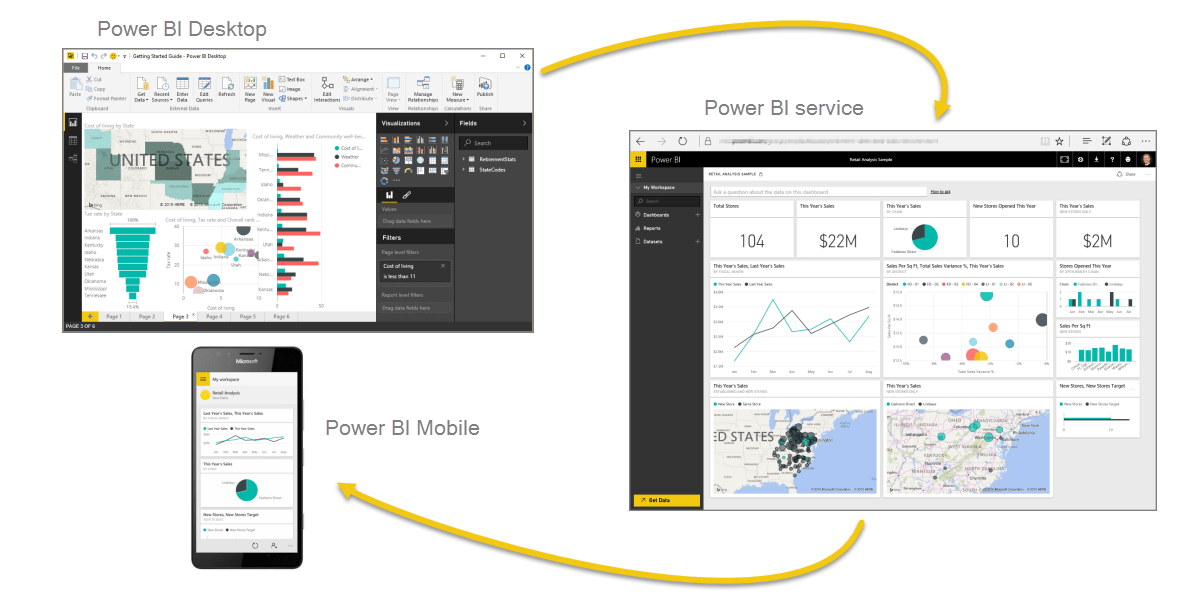
With Power BI Desktop, Microsoft enables every user to load, prepare and visualize self-service data and then distribute it throughout the organization through Power BI Service and Power BI Mobile. Through interactive dashboards, users are always and everywhere able to make the right decisions based on data.
Microsoft is currently a leader in the Gartner Magic Quadrant for BI & Analytics. They have developed an extensive roadmap for products focused on data and analysis. The goal is to integrate these products with Power BI. Examples include: enhancements in augmented analytics, making the new Power BI AutoML functions available in Azure Machine Learning, Azure cognitive services (such as text, sentiment and image analysis) and Artificial Intelligence.
In addition, the Microsoft Azure platform offers a huge range of data-related products / services such as Azure Data lake, Azure Datawarehouse, Azure Analysis Services and solutions from other parties that offer solutions for the collection, management, processing and storage of data.
Strengths of Power BI
1. Easily accessible
Power BI Desktop is completely free. Any user can download it from Microsoft's website and get started. As soon as there is a need to collaborate with colleagues, there is the option to purchase a Power BI Pro license. This costs € 8,40 per user per month or is included with Office / Microsoft 365 E5. Power BI files can then be distributed to the Power BI Service from which people can collaborate on datasets and reports through 'app workspaces'. From the Power BI Service it is possible to prepare content for consumption via the mobile app.
If additional server capacity is required to expand the limits of Power BI Pro, Power BI Premium can be added to the environment. This is available from € 4200,00 per month. Users who create and distribute content must still have a Power BI Pro license. People who only consume content can then access the dashboards and reports for free. It is also possible to integrate Power BI within your own application or website through Power BI Embedded.
2. Easy to get started
For people who work a lot with Microsoft products, Power BI feels like familiar territory. When opening the tool, the well-known Microsoft interface is present, making the product quickly feel familiar and finding the way is fairly easy. This enables every user to quickly create a result in the form of a report or dashboard. The functions from Power Pivot are very similar to those of Excel, making the preparation and transformation of data easy for the average Excel user.
The Gartner study showed that Microsoft reference customers recognize Power BI for its ease of use. Microsoft's “first five minutes to wow” strategy works extremely well and together with the robust community, these are important factors for adoption. For example, solutions to problems you encounter can be found very quickly on Google or Youtube.
3. Integration with other Microsoft products
Power BI, like Office 365, is based on the Azure Active Directory. The creation of groups and users is done in the same way as for Office 365 and / or Azure. This offers many benefits for managing, maintaining and securing access to applications in today's IT landscape. In addition, it is very easy to share reports and dashboards within the organization. This can be done from the Power BI Service and Power BI Mobile, but also via other Microsoft applications such as OneDrive, SharePoint and Microsoft Teams.
In addition to support for the well-known Microsoft applications, it also offers extensive integration with PowerApps, Flow and Dynamics 365. For example, your own Power Apps can be developed where you can perform a certain action from Power BI via the PowerApps visual. See the example from Arriva here where maintenance is scheduled via Power BI as a result of an analysis.
Finally, there is excellent integration with Azure services such as Azure SQL Database, Azure Data Warehouse, Azure Analysis Services, Live Stream Analytics and Azure Machine Learning. For example, an advanced data platform can be created where data can be fully managed from access to action
Points of attention for Power BI
1. Decentralized development
Power BI Desktop is used to unlock data, develop a data model and prepare the first reports for consumption. The result is a (.pbix) file that is saved on the PC of the person who created it, just like your office files. You can then choose to publish it to the Power BI Service so that colleagues and possibly guest users have access to the result. A copy of the file will then be published in Microsoft's Cloud environment.
If one starts without thinking about a strategy for how to deal with these files, a proliferation of .pbix files will arise, whereby you as an organization lose control over the files (and therefore also the data). In addition, only one person at a time can access the source file to work on the data model or dataset.
For larger organizations, a professional approach in the form of Azure Analysis Services and a Data Warehouse will quickly apply. This offers one central environment in which all important organizational data comes together in a safe and manageable way. In addition, this data can be used for things such as Machine Learning and Artificial Intelligence.
2. Cloud only strategy
Cloud offers many advantages in terms of scalability, flexibility and integration with other services. However, when working with sensitive data, you want to maintain control over your own data. Power BI always runs on the Microsoft Azure Platform, there is no choice to place it in a different location.
Microsoft offers an alternative via the Power BI Report server of the same name. This can be installed on your own server of your choice. However, this is not the same product, and it also has a different price tag. This is part of SQL Server Enterprise with SA or is included with a Power BI Premium subscription.
3. Enabler for Microsoft Azure
Starting with Power BI is extremely easy for small organizations and can be realized quickly. As the organization grows, the organization has to deal with more data sources, more complex data models and updates of data that must take place (near) real-time. Power BI therefore has a growth path that must be taken into account.
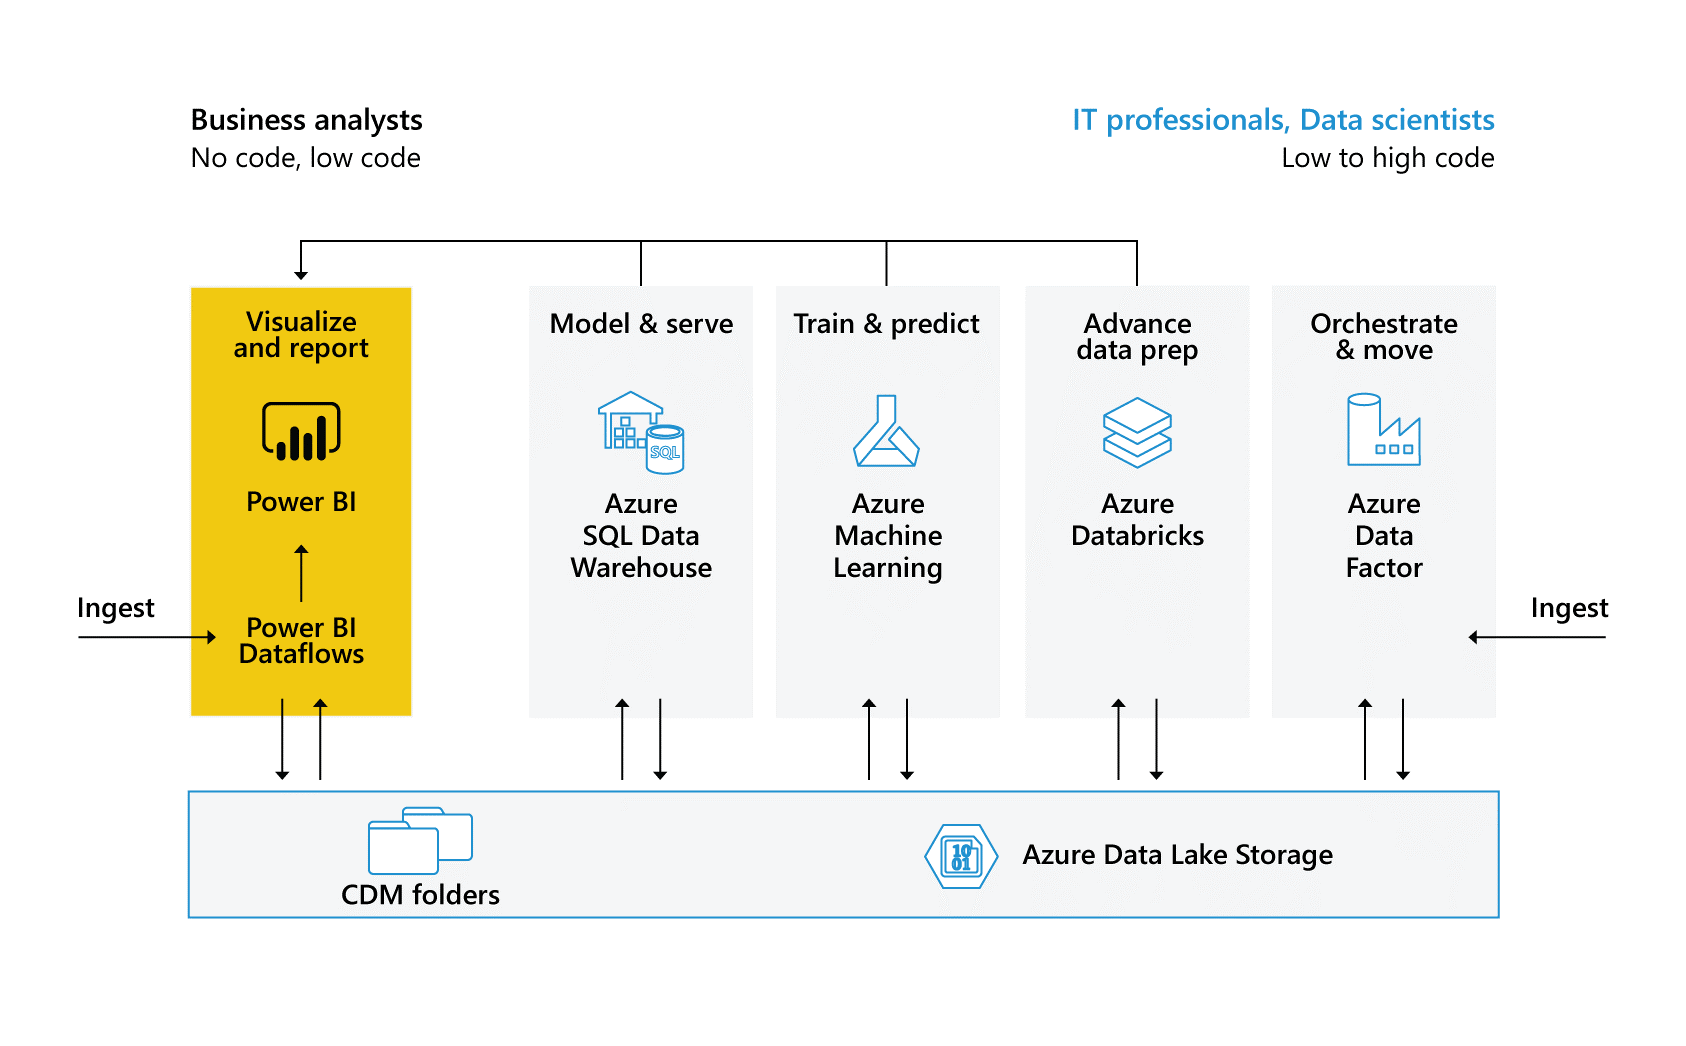
For example, the limitations of a Power BI Pro license with regard to storage capacity and data updates can be solved with a Power BI Premium license and the limitations surrounding decentralized management can be dealt with with Azure Analysis Services. Azure Analysis Services has only a limited number of input sources such as Azure SQL Database, Azure SQL Datawarehouse or on-premise databases such as SQL, Oracle or Teradata. Then the question is how you are going to send the data from your data source to your SQL Datawarehouse. Microsoft obviously has a solution for this with the Azure Data Factory. In short, you quickly get stuck with a whole range of (genuinely very cool) Microsoft products on the Microsoft Azure platform.
In addition to the software solution itself, managing and securing access to Power BI is an important aspect, it is set up and managed from the Azure Active Directory. Due to the additional licenses; Azure AD Premium, Enterprise Mobility & Security E3 / E5 or Microsoft 365 E3 / E5, it is possible to take additional security measures at the user level, such as two-factor authentication and conditional access. If this has not been set up from your Office 365 administrator, it is wise to set this up simultaneously when starting with Power BI.
Qlik Sense Enterprise
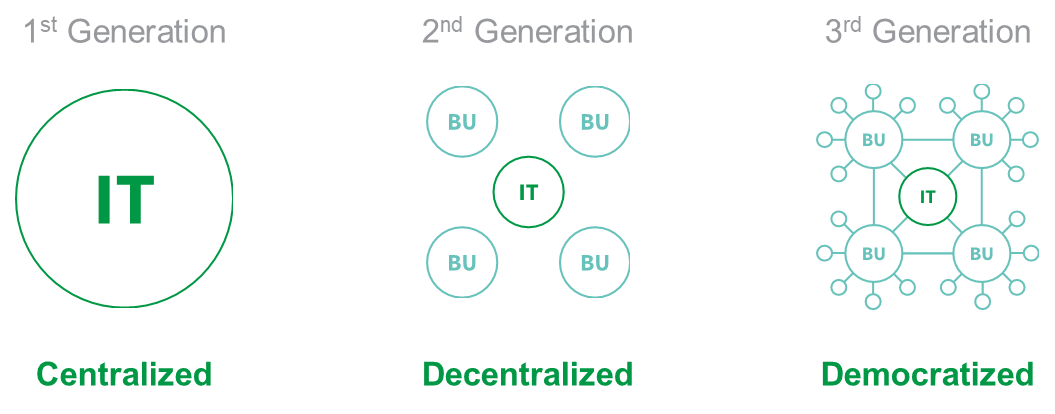
Qlik, formerly known as QlikTech was founded in Sweden in 1993 as a Business Intelligence (BI) software company. Qlik focuses on creating a data-literate world. Where people, companies, organizations and governments use data to solve their most complex challenges. In the time when IT was central to the world of business intelligence came Qlik with a solution, called QlikView, to decentralize BI. With QlikView reports and dashboards could be prepared for management to receive the right steering information at the right time.
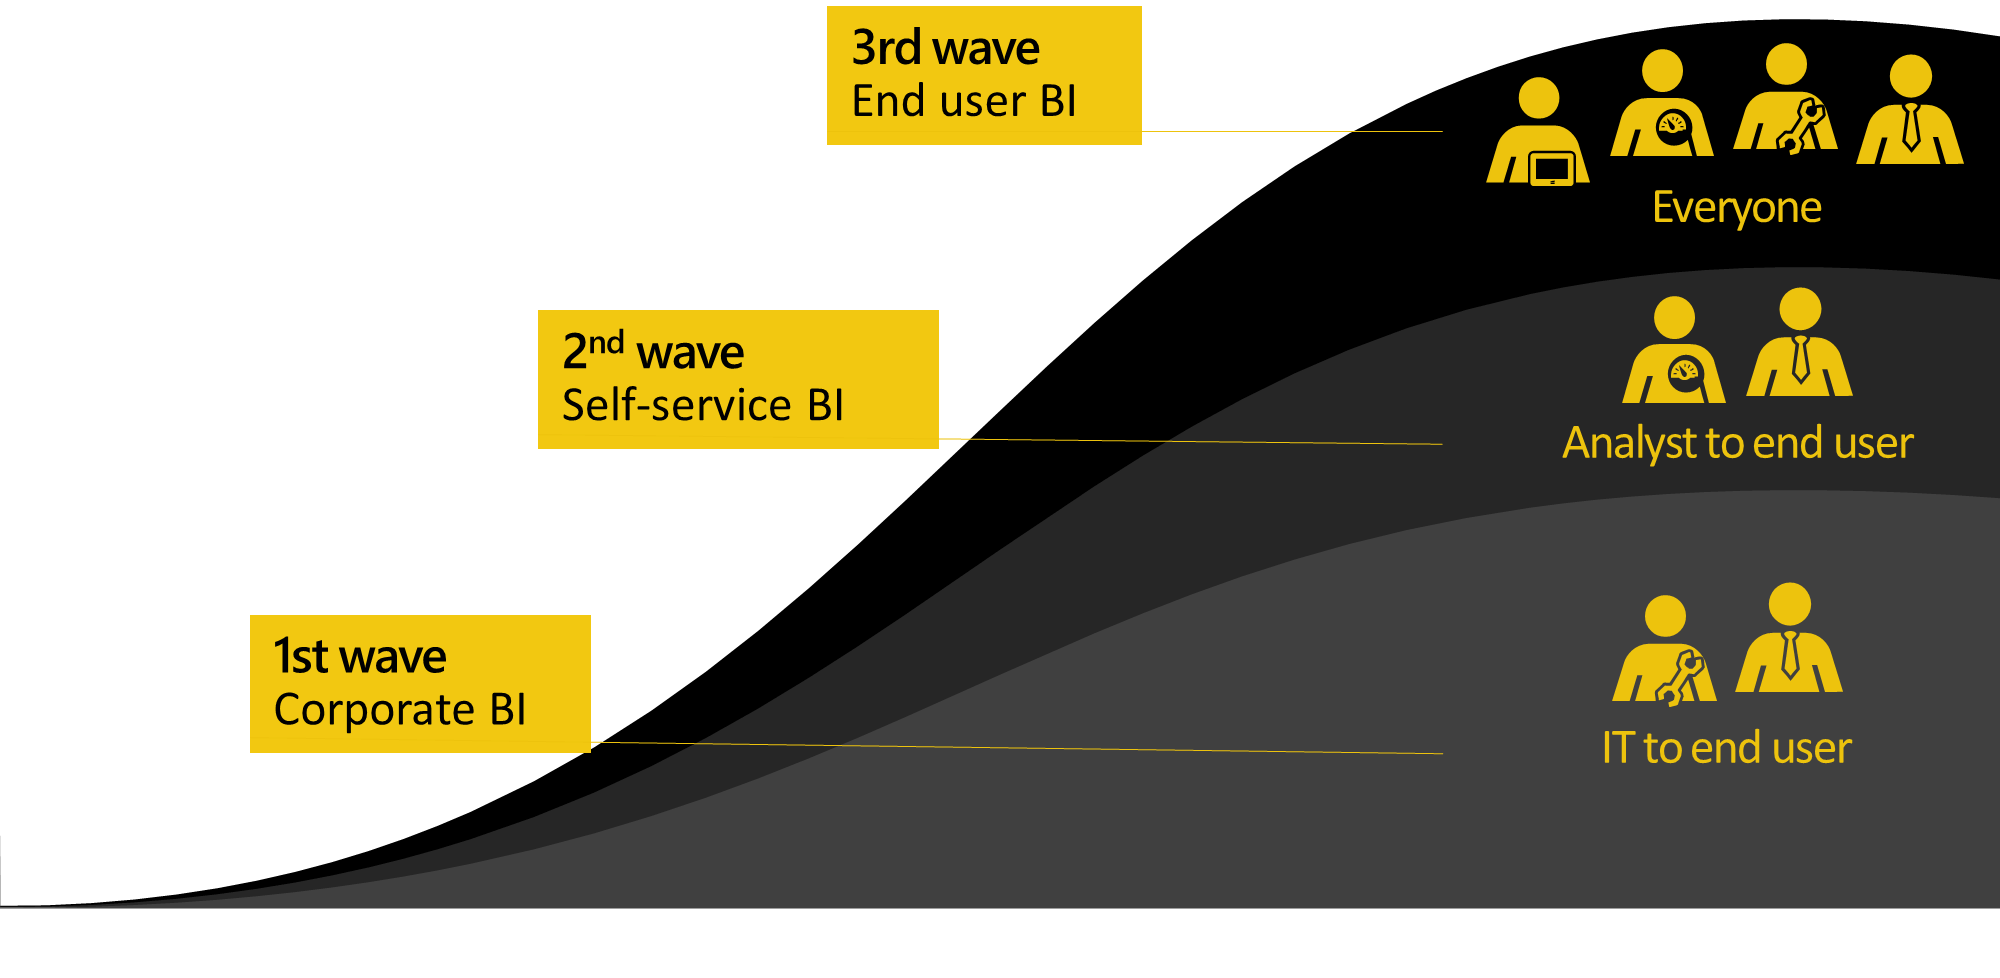
The 3rd generation BI has now arrived, Qlik calls this 'Democratized BI'. Everyone can use their data self-service. In doing so, steers Qlik especially on data literacy within an organization. Employees are enabled by IT to work with data themselves, it is essential that the data skills of employees do not lag behind.
The flagship of Qlik is Qlik Sense Enterprise, focused on self-service analytics. Qlik Sense provides a centralized hub from which any user can find and share relevant data analytics. Using the drag and drop interface, users can create interactive data visualisations and then present them through story telling. Qlik Sense has the ability to support multiple data sources, complex data models and complex calculations. The data is loaded in-memory so that it is ready to be analyzed. The platform can also be used to develop custom applications through a comprehensive set of embedded analytics APIs.
In recent years Qlik investing frequently to be able to offer an end-to-end data platform. Came early 2018 Qlik to come up with Qlik Core. Qlik Core is a development platform on which developers can build applications for cloud or edge deployments. In 2018 and 2019 Qlik both Podium Data and Attunity for data management and announced last January Qlik the acquisition of Crunch Data in order to be able to perform analyzes using advanced conversation techniques.
In addition to recent acquisitions Qlik the first to have a vision of multi-cloud deployments managed through a single interface. Qlik processes big data with its On-Demand App Generation and extends those capabilities with the new Associative Big Data index. Qlik continues to evolve on its augmented analytics roadmap, improving data preparation and embedded analytics capabilities. The position of Qlik in the Leaders quadrant from Gartner is mainly attributable to the strong roadmap for products, geographic spread and market understanding.
Strengths of Qlik Sense.
1. Qlik's Associative Engine
Qlik is the only business intelligence supplier to have a patented technology called: associative engine. You use this associative engine with every filter you apply to explore your data. With the Power of Gray you are able to see what is going on in your data when you make a selection. This works as follows:
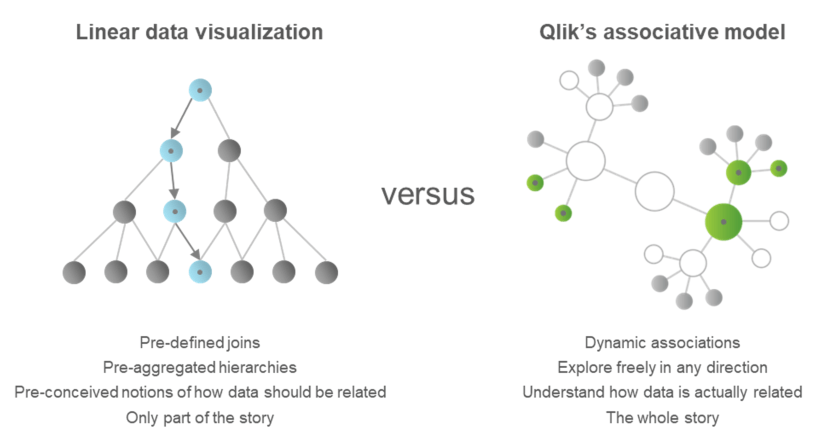
Example: Your sales manager (Jan) looks at the results of the account managers. Jan sees that Bob has done very well last month and looks at product Jan has sold the most. Bob has sold a product with a lot of margin and Jan is satisfied with that. At a glance, Jan also immediately sees which account managers have not yet sold this product, as they are indicated with a gray color. Qlik calls this the Power of Gray. Jan immediately sees which account managers need direction and can take action. This saves a lot of time compared to a Query-based tool. John would otherwise have to filter per account manager to see who has or has not sold the same product. Watch this video for an example in practice.
2. All in one platform
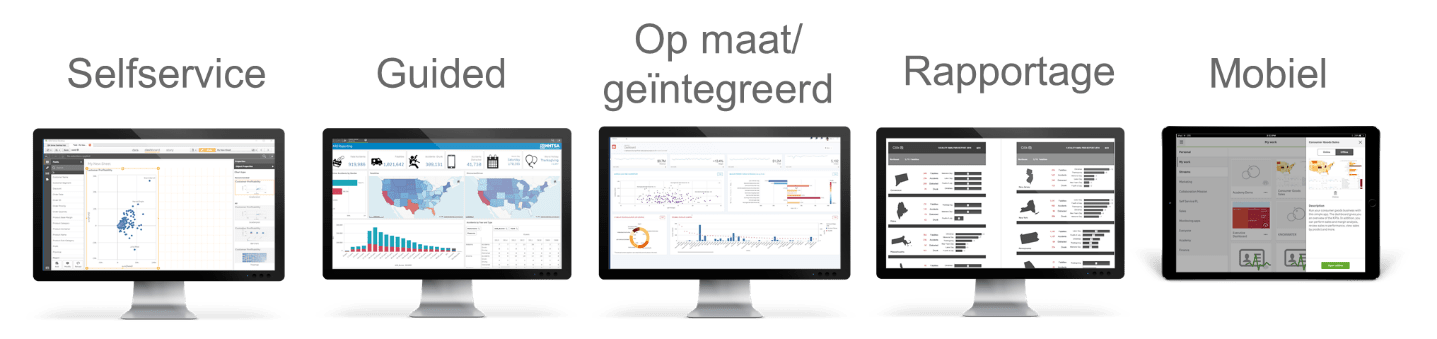
Unlike other suppliers Qlik an all-in-one platform. The platform offers all possibilities for accessing, transforming and loading data, in-memory data storage, self-service analytics, guided analytics, embedded analytics and last but not least enterprise security and governance options.
An important aspect here is that all possibilities are included in the product. This means that you have all the possibilities of an Enterprise BI tool, that you can get started quickly and that the costs are easy to predict. Payment can be made per user per month without having to purchase other (extra) products / services.
Qlik Sense is an open platform where you as an organization can determine for each part how you are going to set up, manage and secure it. Qlik provides support for all deployment scenarios. So you can Qlik Sense are installed on a server of your choice, regardless of where it is located. For Enterprises it is possible to realize a development, test, acceptance and production (OTAP) street and / or the workload of Qlik Spread Sense over multiple servers through a Multi-node deployment. Also offers Qlik Sense support for multi-cloud scenarios through Qlik Sense for elasticity.
3. Everything via the browser, fully responsive.
Loading data, editing, transforming and developing dashboards can all be done via the browser. It can be determined yourself whether Qlik Sense is made available from the corporate network or over the internet through your own domain. Qlik Sense adapts completely to the device with which you visit the website. Optionally, it is also possible to install the app for iOS or Android. User management is based on the Qlik Management Console that can also be accessed via the browser.
It is also possible to use Mash-ups Qlik Sense can be fully integrated into a website. For example, FloraHolland has published its full annual report Qlik integrated into its website. Click on this link to watch this live.
Points of attention for Qlik Sense.
1. Price
For personal use, the Qlik Sense Desktop is free to download. If you work with several colleagues, a Cloud version for teams is available for € 12,50 per month, where you must pay with a credit card. The data is then stored in the by Qlik chosen Amazon data centers.
For the complete version you should choose Qlik Sense Enterprise. Compared to other BI tools, this is quite an expensive solution. For example, a Professional user costs (€ 57,50 pm) and an Analyzer user (€ 33,00 pm). In addition, a dedicated server must be made available to run the software.
Unlike other tools, with Qlik In many cases, Sense no longer requires a central database / data warehouse or ETL tool. These functionalities are all included Qlik and the data is centrally stored and managed on the server.
2. Self-service level
Qlik offers many functionalities for self-service BI such as: automatic data modeling, drag-and-drop worksheet and insights with machine learning capabilities. But the question I would like to ask is: to what extent are these functionalities actually self-service if these functionalities require some knowledge? Like many other applications, you will need to know where to click and how to handle data. From our experience we notice that users, without training, can get started more easily with other business intelligence tools. Once the buttons are known, as promised, it is indeed all quite simple.
3. Subscription only strategy
Entirely in line with the trend of software suppliers Qlik a subscription model was created a few years ago. Since the beginning of 2019, it is only possible to purchase licenses in a subscription model. Qlik however, runs on a server and many customers pay once for a server and for windows server licenses.
Of course everything goes to a subscription model and many servers in the cloud are offered in a subscription model. However, in the event that everything still has to run on-premise, there is no possibility to choose one type of payment model for all components.
Hybrid Scenario
We increasingly see that various business intelligence tools are used within an organization. Different departments often choose a different tool because of the available software knowledge or scripting language. For example, the entire organization may have Qlikview of Qlik Sense works but that the financial controllers like to work with Power BI for their own reports, because they know the formula language of Excel very well.
If there is a central point where all data comes together, usually in the form of a data warehouse with an ETL layer, then the end user can use a BI tool of his choice. The necessary data preparation and transformation can then be captured in the data management layer and a BI tool only needs to retrieve the correct dataset to be able to create visualisations.
The advantage of using multiple business intelligence tools is that employees can decide for themselves what they want to work with. This can improve the adoption of BI within your organization. On the other hand, the disadvantage is that all business intelligence tools must be managed and maintained so that no unwanted access is obtained and the most recent versions are always available. There are additional costs for this.
Conclusion
The purpose of this article was to provide insight into some of the key differences between Power BI and Qlik Sense. Both tools have advantages and disadvantages and are suitable for different purposes. It is therefore important to realize a plan where you as an organization want to grow in the field of BI. This 'dot on the horizon' will be leading in the choice of purchasing a BI tool. If you would like to discuss this once, I, or my colleagues, can be reached via 074 - 2915208 or the contact form in this blog
Hopefully, the information in this article has helped to better understand the different applications.
References
https://docs.microsoft.com/nl-nl/power-bi/service-machine-learning-automated
https://docs.microsoft.com/nl-nl/power-bi/service-cognitive-services
https://powerbi.microsoft.com/nl-nl/pricing/
https://powerbi.microsoft.com/nl-nl/roadmap/
https://youtu.be/mN7xnqvdqRA?t=3896
https://www.gartner.com/en/documents/3900992
https://www.qlik.com/us/products/qlik-sense
https://www.qlik.com/us/pricing
https://www.qlik.com/us/products/technology
https://www.youtube.com/watch?v=CuxKfp7PW1o&t=196s