

 Search

 Call: 074-2915208
Vizlib - a quick introduction
Vizlib recently added new plug-and-play analysis capabilities to the Vizlib library, such as predictive forecasting within the Vizlib charts. With one click you can use mathematical algorithms inside Qlik Sense.
Advanced Analytics
Advanced Analytics is a next-generation suite of analytic methods that use advanced modeling techniques and mathematical algorithms to uncover deeper insights, help organizations identify patterns, predict trends, and drive change with fact-based solutions. It offers companies the opportunity to get sophisticated, detailed answers to complex questions.
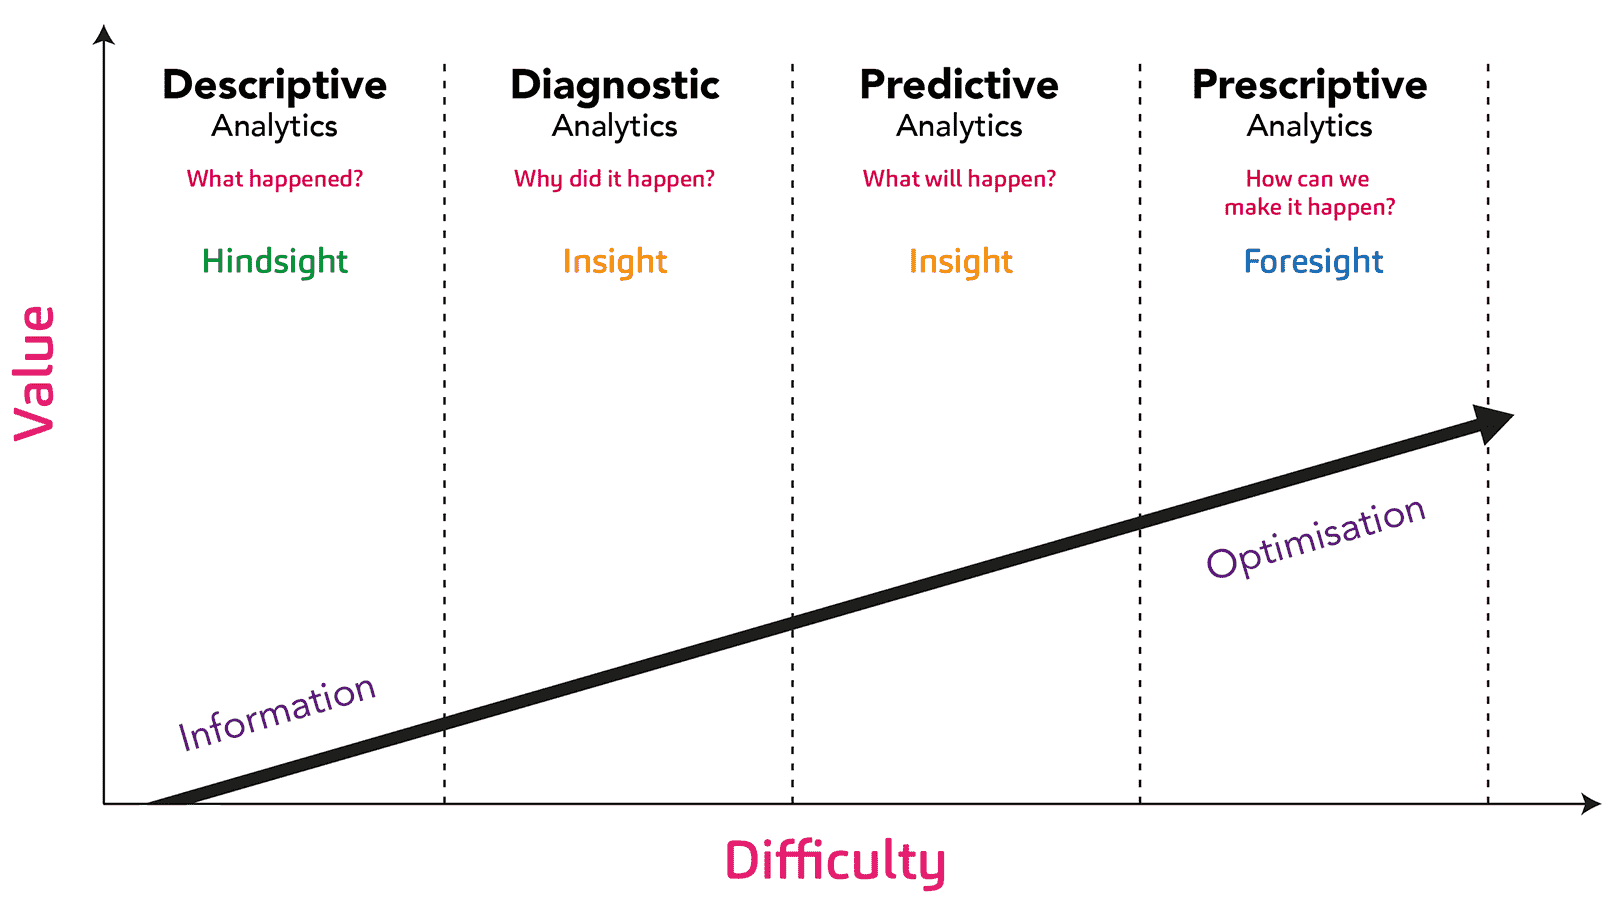
While advanced analytics is about optimizing and predicting the best next action, business intelligence focuses on reporting based on statistics, dashboarding, and ad hoc queries (typically classified as descriptive analytics). It uses historical and current data to help organizations access more effective strategic, tactical and operational insights and decision-making. The main difference between business intelligence and advanced analytics is that the former focuses on the past (what happened?) And the latter tries to predict the future (what's next?).
How do companies use advanced analytics?
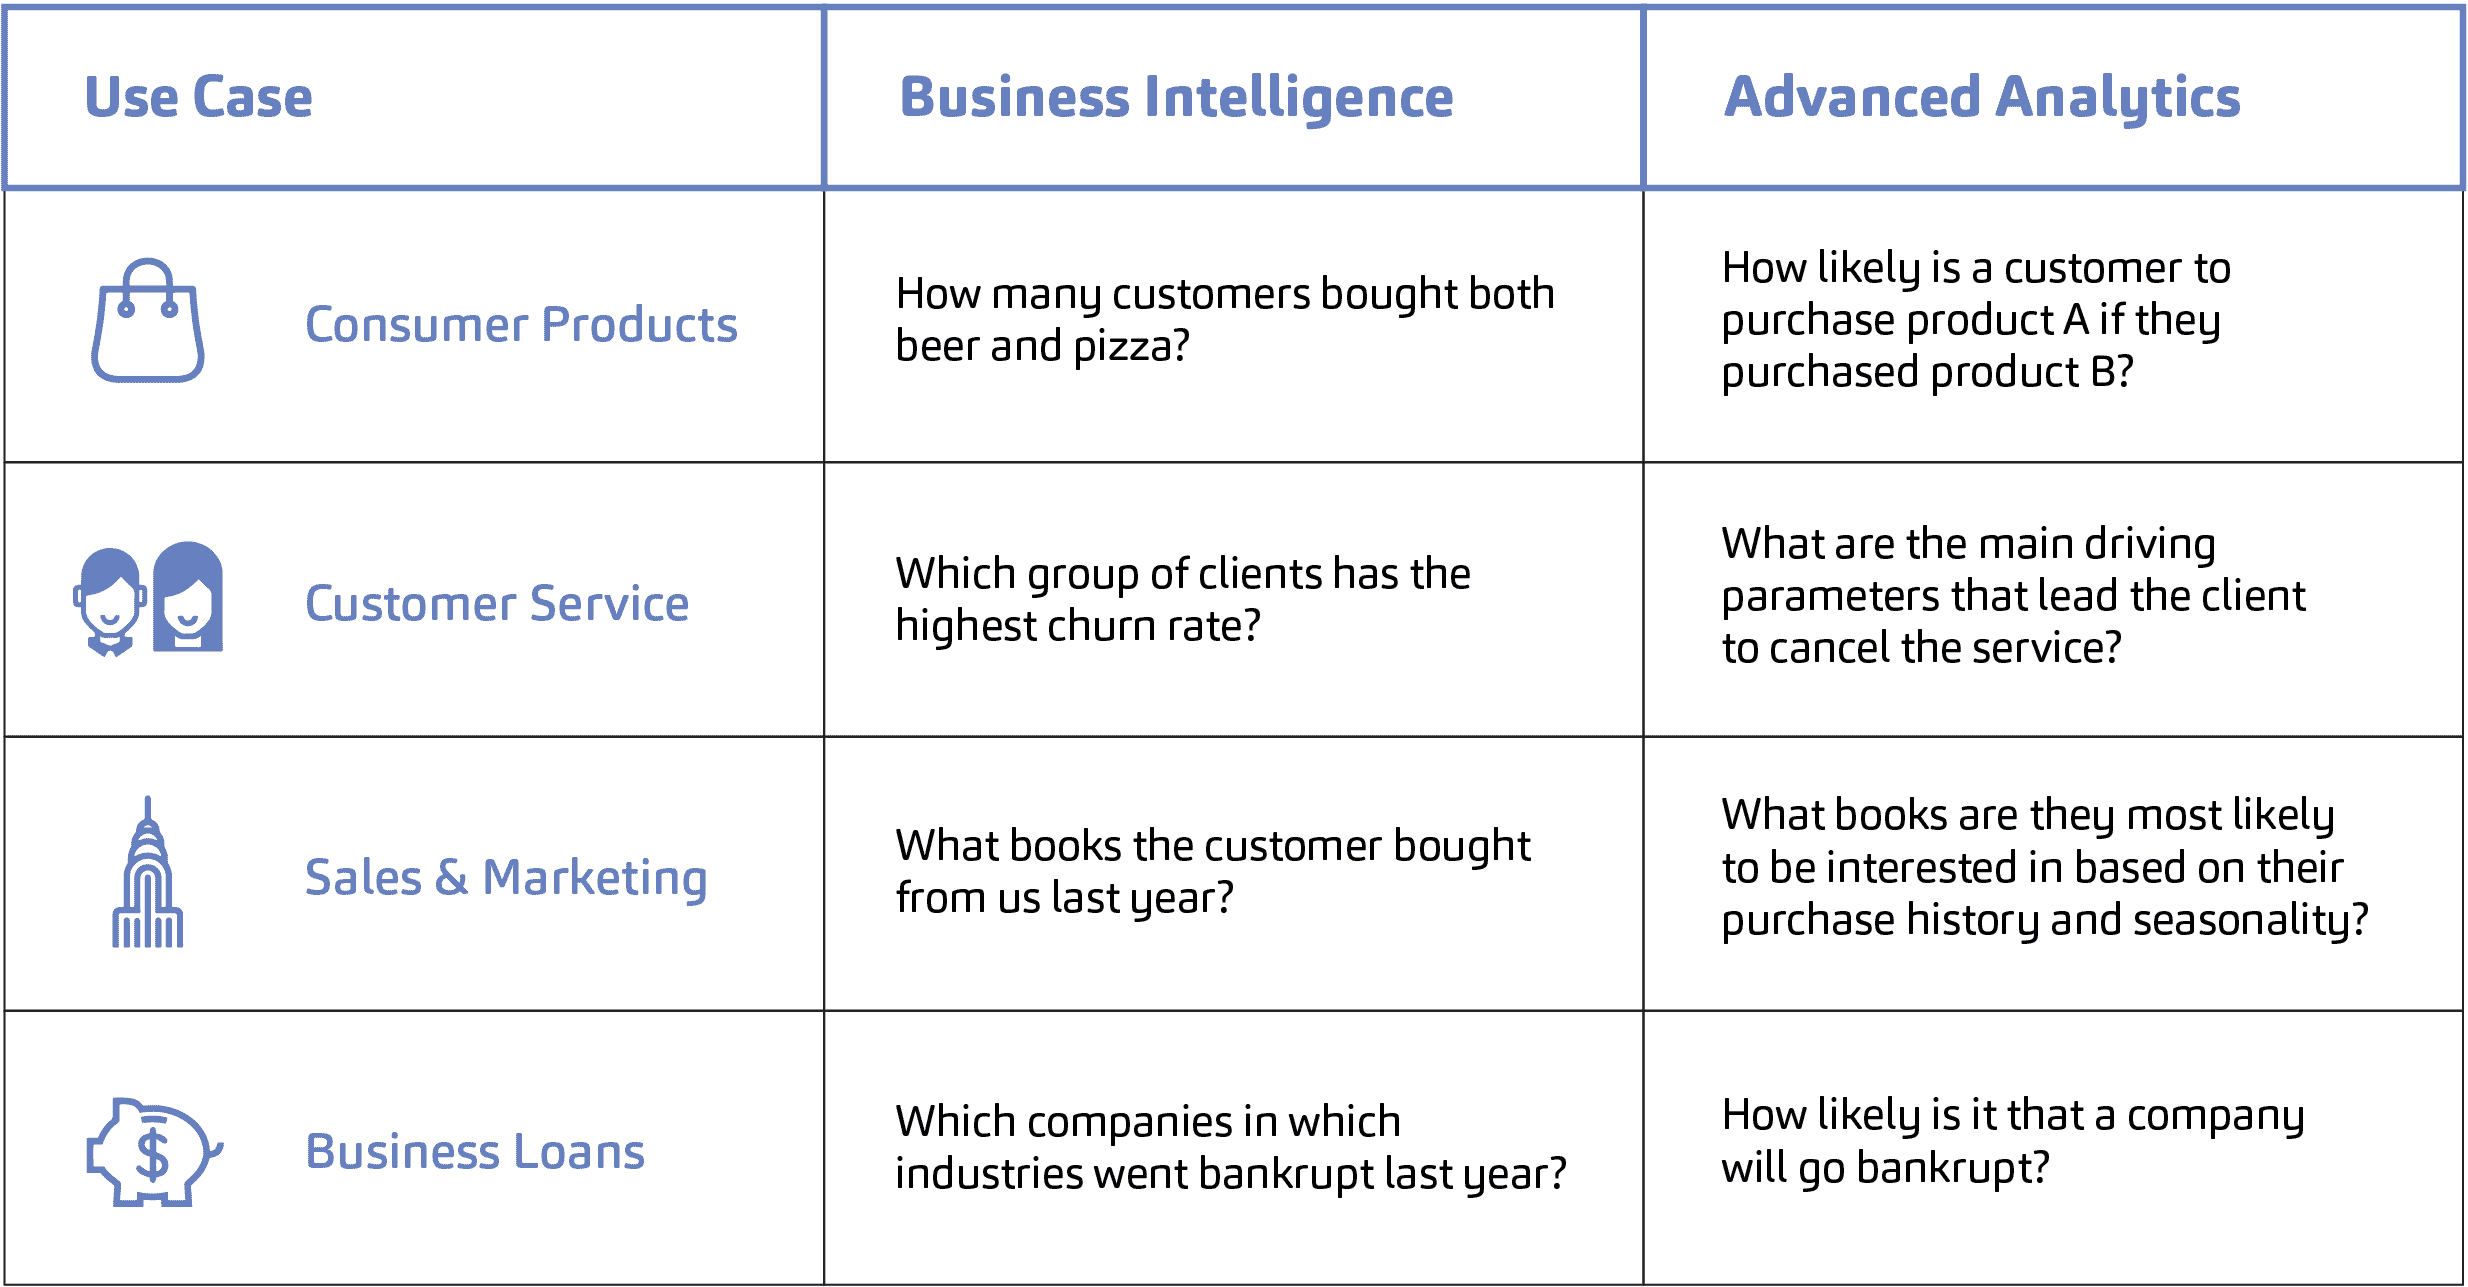
The applications of advanced analytics are wide and varied, ranging from classic sales and demand forecasting to predictive police solutions and customer success optimization. To give you a quick example, here are some common business intelligence versus advanced analytics scenarios.
Companies that decide to invest in and try advanced analytics often strive to improve their internal processes, such as risk or customer relationship management, develop new products or services, focus their offerings on their customers, or improve their existing products.
The ability to leverage advanced analytics gives organizations the ability to make more predictive and real-time decisions, often resulting in improved, more cost-effective performance. According to research, 58% of data-driven organizations performing predictive analytics see “a link between analytical initiatives and a” significant improvement “in their competitive positions”.
Despite increasing dependence on data-driven solutions, companies still lack skilled in-house workers to understand all that data. In addition, many organizations cite lack of budget as another major blockage to their analysis efforts. And even those organizations that are making progress in capitalizing business data and successfully implementing analytics strategies don't always have the ability to leverage data science.
But as markets evolve at breakneck speed and various technology glitches still affect virtually all industries, having a competitive advantage provided by advanced analytics will determine winners and losers in the industry.
Predictability in the Vizlib line chart
Our built-in forecasting capability for the Vizlib line chart allows you to forecast trends and make predictions in time series based on historical and near-real-time data. It divides the time series into 4 constituent parts: level, trend, seasonality and noise. Then a triple exponential smoothing algorithm (Holt-Winters approximation) is used to calculate the forecast for the given time series components and parameters.
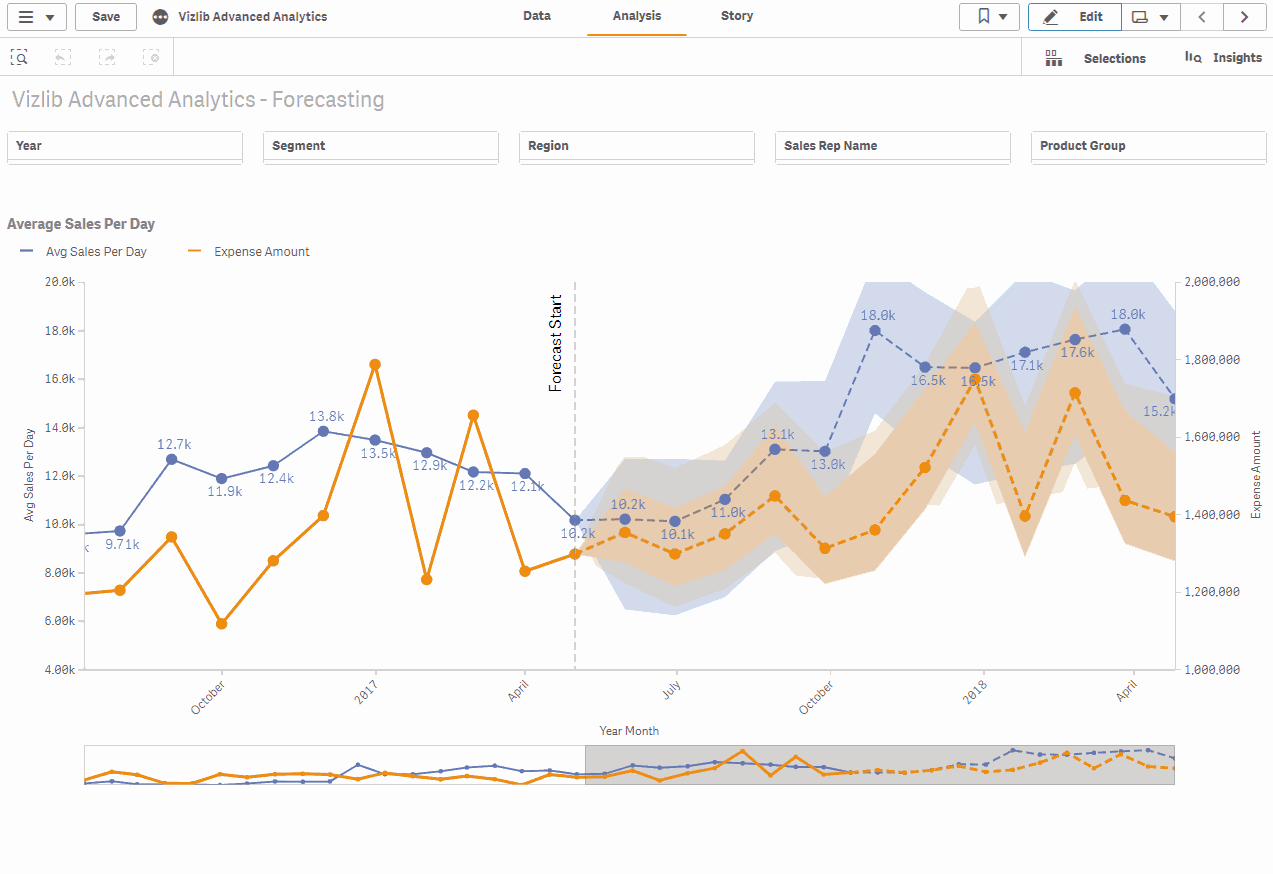
The provided algorithm uses a model auto-fit to optimize the forecast by minimizing the prediction error (the difference between actual and predicted values). As a user, you can choose the optimization level (from economic to bazooka), which leads to a more accurate result by increasing the computational effort. In addition, it calculates the prediction interval using a bootstrap method.
Both the predicted values and the prediction interval are added to the line graph at the end, extending your time series into the future.
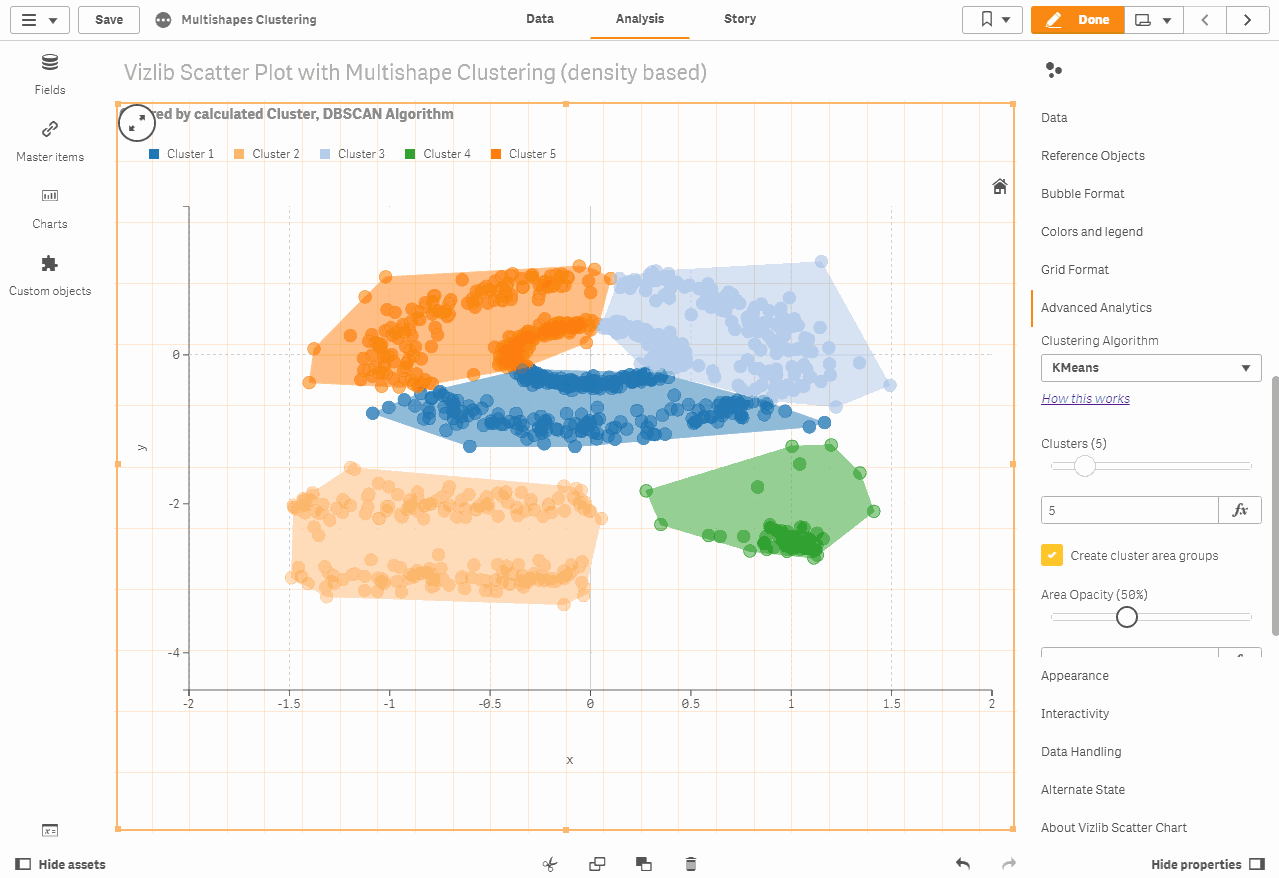
Cluster ability in the Vizlib scatter chart
The following are our newly added cluster capabilities in the Vizlib scatter chart. Clustering is a task that groups data points into categories by analyzing their matches. Simply stated, the purpose of clustering techniques, such as K resources that we use in our scatter chart, is to distinguish groups with similar functions and assign them to relevant clusters.